Co-location Peformance History
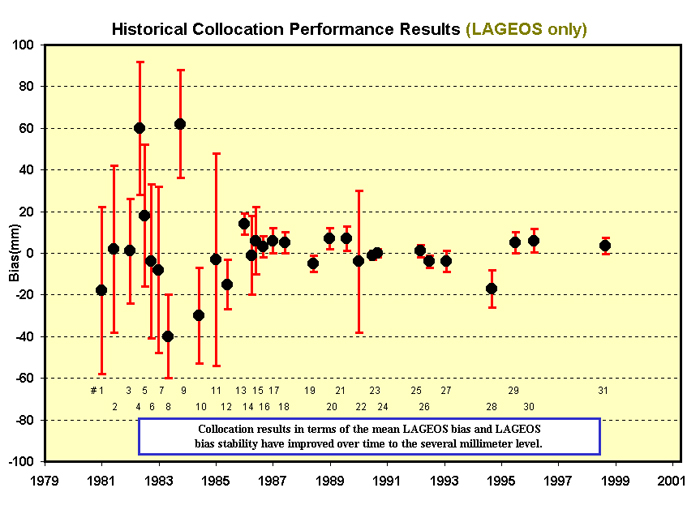
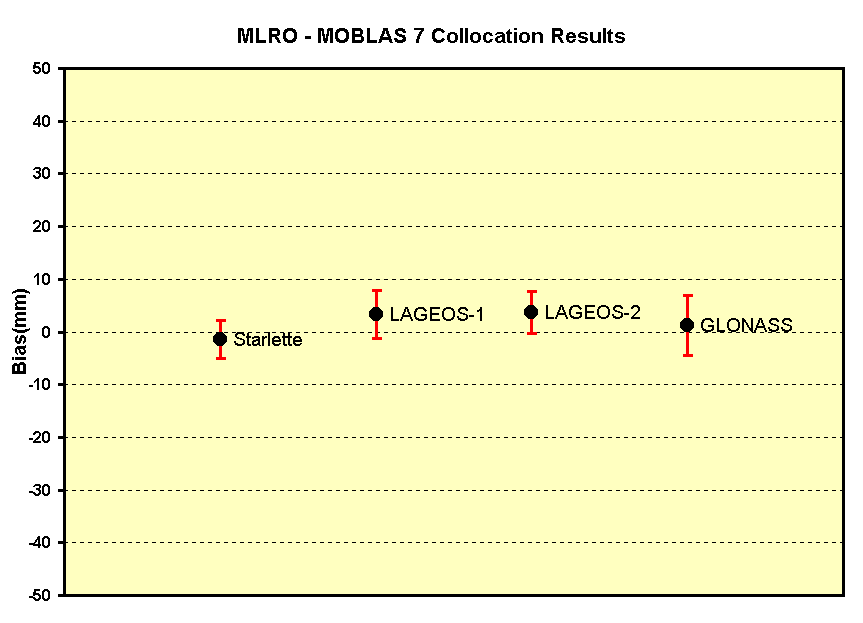
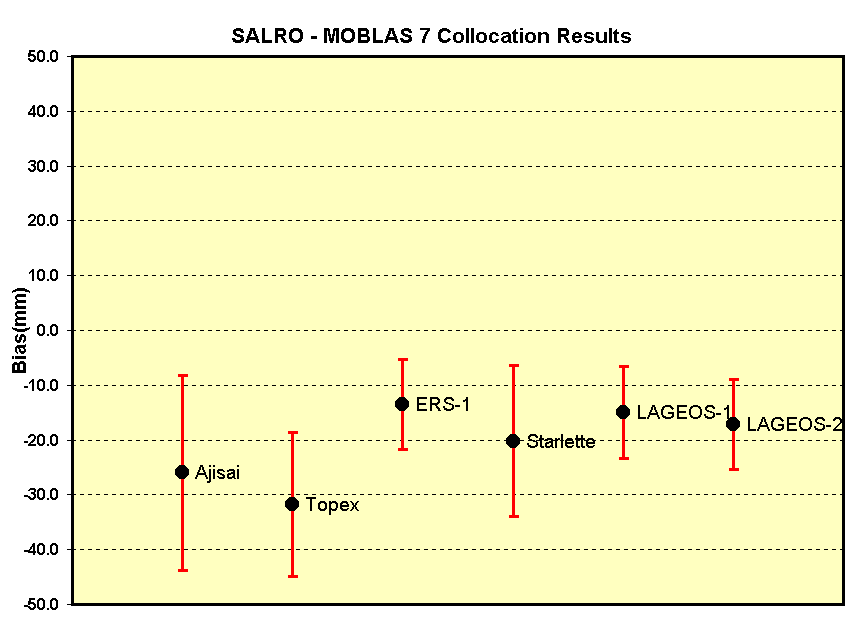
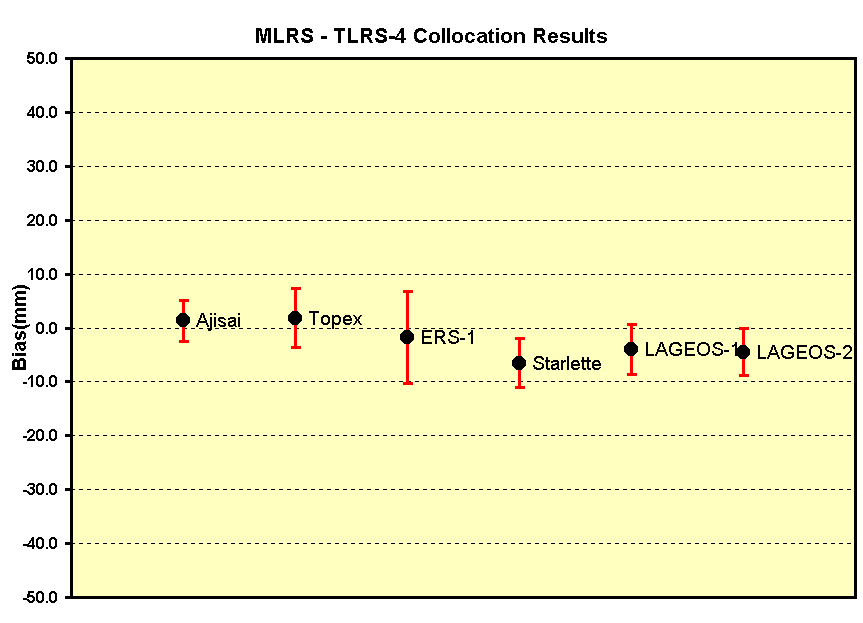
Table 1 below contains a co-location history based on PolyQuick LAGEOS analysis results by NASA/AlliedSignal Technical Services Group (ATSC). For a graphical representation of this results click here. For more detailed results (i.e. all satellites) from some of the more recent co-locations (MLRO/MOBLAS 7, SALRO/MOBLAS 7, MLRS/TLRS-4), click on the appropriate hyperlink. Note: Please if you want to print the graphs set the printer page layout to landscape prior to printing.
Collocation analysis is the process of comparing ranging data to the 1 millimeter (mm) level from two or more satellites laser ranging systems in close proximity (<600 meters, preferably <60 meters) by quasi-simultaneously ranging to common retro-reflector equipped satellite. There have been two primary co-location analysis tools, orbital and geometric. Both techniques have their strengths and weaknesses and can and should be used in tandem to compliment each other.
The purely geometric technique, PolyQuick, was developed for NASA by ATSC, formerly Bendix Field Engineering Corporation (BFEC), in 1981. PolyQuick, in the mid 1980s, replaced the traditional orbital technique (e.g. GEODYN and UTOPIA) as the primary NASA co-location analysis tool. In the early co-locations, only LAGEOS data was used for performance evaluation. Both of these techniques have been enhanced to eliminate non-overlapping periods of ranging and aggregating residuals from multi-arcs and satellites.
Collocation analysis was and is still the best engineering tool available for rapid identification of sub-centimeter systematic error sources. SLR bias sources have been found in each sub-system of the SLR data chain (i.e. hardware, software, survey, operational procedures, meteorological sensing, epoch timing closure, data processing, and data analysis). The magnitude of the systematic biases have approximated the single shot LAGEOS Root Mean Square (RMS) precision.
In the early 1980s, the NASA SLR systematic errors and single shot precisions were at the 50-100 mm level. In the mid to late 1980's, co-location analysis was used extensively to verfiy the NASA SLR system performance upgrades. These performance enhancements included an order of magnitude improvement in data precision, data accuracy, and bias stability. The system improvements resulted from SLR technological advances (e.g. micro channel plate photomultiplier tubes; low jitter discriminators; short-pulsed mode locked lasers; short and stable calibration targets; better calibration procedures; higher accuracy survey equipment and procedures; GPS receivers; and improved data reduction algorithms). By the late 1980s, the NASA MOBLAS and TLRS systems were consistently producing 10 mm LAGEOS single shot precisions with systematic errors at or below the 10 mm level.
# |
Start Date |
LAGEOS Bias (mm) (Test-Standard) |
Sigma (mm) |
Standard System |
Test System |
| 1 | Jan 1981 | -18 | 40 | STALAS | MOBLAS 7 |
| 2 | Jun 1981 | 2 | 40 | MOBLAS 1 | HOLLAS |
| 3 | Jan 1982 | 1 | 25 | MOBLAS 7 | MOBLAS 4 |
| 4 | May 1982 | 60 | 32 | TLRS 1 | MLRS |
| 5 | Jul 1982 | 18 | 34 | MOBLAS 7 | MOBLAS 6 |
| 6 | Oct 1982 | -4 | 37 | MOBLAS 7 | TLRS 2 |
| 7 | Jan 1983 | -8 | 40 | MOBLAS 7 | MOBLAS 4 |
| 8 | May 1983 | -40 | 20 | TLRS 1 | MOBLAS 8 |
| 9 | Oct 1983 | 62 | 26 | TLRS 1 | MOBLAS 4 |
| 10 | Jun 1984 | -30 | 23 | MOBLAS 8 | TLRS 1 |
| 11 | Jan 1985 | -3 | 51 | MOBLAS 7 | MOBLAS 2 |
| 12 | Jun 1985 | -15 | 12 | MOBLAS 7 | MTLRS 1 |
| 13 | Jan 1986 | 14 | 5 | MTLRS 1 | MTLRS 2 |
| 14 | Jan 1986 | -1 | 19 | MTLRS 1 | SAO 1 |
| 15 | Jan 1986 | 6 | 16 | MTLRS 2 | SAO 1 |
| 16 | Sep 1986 | 3 | 5 | MOBLAS 7 | TLRS 1 |
| 17 | Jan 1987 | 6 | 6 | MOBLAS 7 | TLRS 2 |
| 18 | Jun 1987 | 5 | 5 | MOBLAS 7 | TLRS 3 |
| 19 | Jun 1988 | -5 | 4 | MOBLAS 7 | TLRS 4 |
| 20 | Jan 1989 | 7 | 5 | MOBLAS 7 | TLRS 1 |
| 21 | Aug 1989 | 7 | 6 | MOBLAS 7 | TLRS 3 |
| 22 | Jan 1990 | -4 | 34 | TLRS-3 | SAO 2 |
| 23 | Jul 1990 | -1 | 2 | MOBLAS 7 | TLRS 4 |
| 24 | Sep 1990 | 0 | 2 | MOBLAS 7 | TLRS 1 |
| 25 | Mar 1992 | 1 | 3 | MOBLAS 7 | TLRS 3 |
| 26 | Jul 1992 | -4 | 3 | MOBLAS 7 | TLRS 4 |
| 27 | Feb 1993 | -4 | 5 | TLRS 4 | MLRS |
| 28 | Sep 1994 | -17 | 9 | MOBLAS 7 | SALRO |
| 29 | Jul 1995 | 5 | 5 | MOBLAS 7 | MOBLAS 6 |
| 30 | Mar 1996 | 6 | 6 | MOBLAS 6 | MOBLAS 7 |
| 31 | Sep 1998 | 3 | 4 | MOBLAS 7 | MLRO |
